Data Entry #
Input Data #
All data entry in Dartis SPT is performed in Input tab.
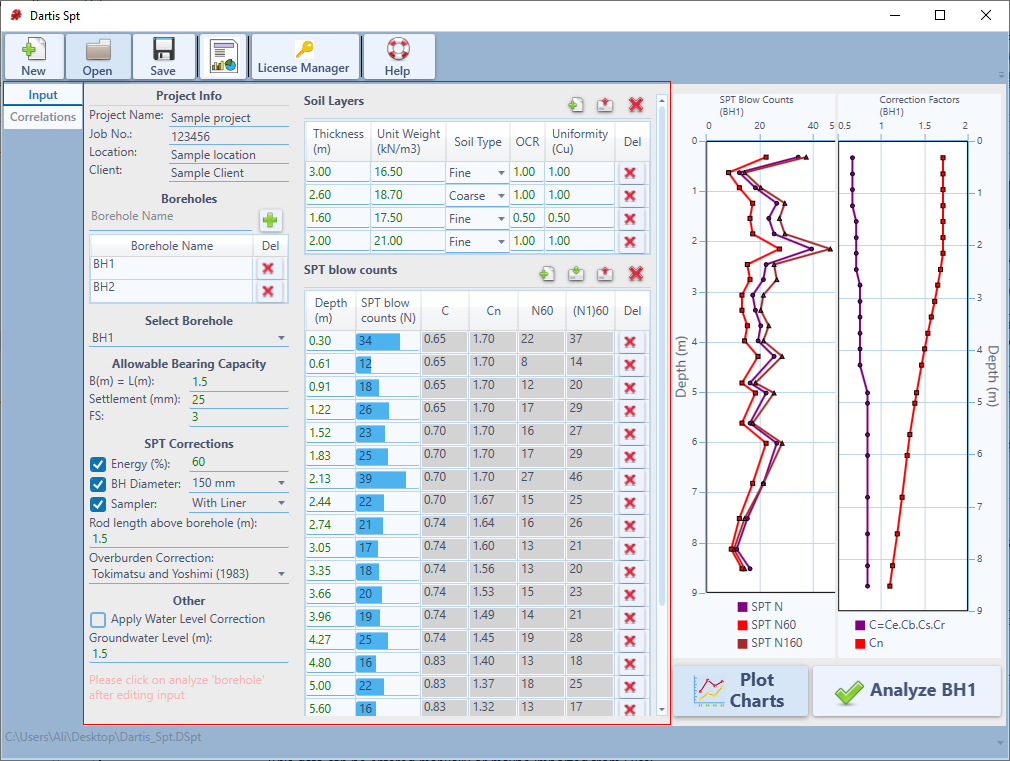
This data can be categorized into the following groups:
Project Info:
Simply enter project’s information in this section. This information presents in reports.
Boreholes:
Type the name of the borehole and add it to the project. Select the desired borehole from the combo box. Rest of input data will be applied to the currently selected borehole.
Allowable Bearing Capacity:
This data is used for calculating bearing capacity of shallow footings based on shear failure or settlement criteria (based on method). Footing size and allowable footing settlement as well as safety factor against shear failure should be specified. Please notice that depth of footing (Df) is considered to be the depth (Z) selected by user on SPT table.
SPT Corrections:
The following corrections should be applied on SPT number (N) to obtain N60 and N1(60) numbers:
·Energy level: this will adjust the SPT equipment energy to standard 60% energy. This correction factor is named Ce in Dartis SPT.
·Borehole diameter: size of the borehole affects the SPT blow counts. This correction factor is named Cb in Dartis SPT.
·Sampling method: some SPT samplers have a liner. This will affect the SPT blow counts and its correction factor is called Cs in Dartis SPT.
·Rod length: this correction factor is called Cr and depends on length of SPT rods which is approximately equal to the depth of the test. Dartis SPT Adds rod length above borehole (entered by user) to the total test depth when calculating Cr: If L < 4 m ⇒ Cr=0.7, If 4 m < L < 6 m ⇒ Cr=0.85, If 6 m < L < 10 m ⇒ Cr=0.95, If L > 10 m ⇒ Cr=1.0
·Overburden stress: this corrections is usually called as “depth correction factor” or Cn and depends on overburden stress due to soil, at the test depth.
Please choose your favorite method for each correction factor. The following formula is used to calculate the correction factors at each depth:
C=Ce.Cb.Cs.Cr N60=C.N N1(60)=Cn.N60
All the above-mentioned factors as well as N60 and N1(60) are plotted versus depth and presented on screen.
Other:
The groundwater level affects the calculation of effective overburden stress (σ’v) used in the correlations. In addition, user can choose to apply the water level correction on SPT blow counts, as proposed by Terzaghi. This correction is recommended for N≥15 in silty sands:
Ncor=15+0.5(N60-15)
Soil Layers:
This data is used to calculate the effective and total overburden stress at each depth where correlations are required. Please pick the soil grain size for each layer from the drop down list (Coarse / Fine). This is used by Dartis SPT to filter correlations based on grain size.
Some SPT correlations depend on OCR and Cu of the soil. These parameters should be specified for each soil layer.
This data can be entered manually or maybe imported from Excel.
SPT data table:
In this table please enter raw data gathered from SPT test. The first two columns of this table include depth and SPT blow counts (N) and the other columns are automatically calculated during data entry. When this data is entered, Click on ‘Plot Charts’ to update and present both SPT blow counts and correction factors along depth of borehole.
This data can be entered manually or maybe imported from Excel.
Note: Never enter zero for a SPT test depth; it may lead to calculation errors. This is due to dependency of most Cn methods to σv which will be zero at Z=0.
Adding row to Tables #
For adding a new row to a table, simply press button on top-right side of the table or right click on table header and choose ‘New Row’ between options.
Clearing Tables #
For clearing all data entered in a table, simply press button on top-right side of the table or right click on table header and choose ‘Clear Table’ between options.
SPT Graph #
Once you enter SPT versus depth data, and press ‘Plot Charts’ button at the bottom-right corner of the screen, SPT graph is updated and un-corrected as well as corrected SPT numbers are plotted versus depth. Another graph shows the variation of SPT correction factors against depth. Right Click on each graph to print it.
Analyzing a borehole #
When data entry is finished for the selected borehole, simply click on the ‘Analyze borehole’ button. This will calculate correlations and then you can choose ‘Correlations’ then ‘Equations’ Tab in which by selecting the required ‘Borehole’, ‘Depth’ and ‘Parameter to correlate’; correlations are provided for this depth of selected borehole.
Toolbar #
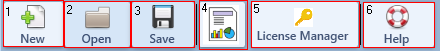
1.Creates a new project: by clicking on ‘New’ button, a dialogue will open. Choose the location where you want the project to be saved. Files are saved with *.DSpt extension and the complete file path is shown at the bottom of the page.
2.Opens a previously created project file: by clicking on Open button, an open dialogue will show up. Choose the save file on your local hard. Files are stored with *.DSpt extension.
3.Saves currently open project: saves current project’s information on currently open save file. The save file path is shown at the bottom of the page.
4.Opens report
5.Opens License Manager window.
6.Opens Help
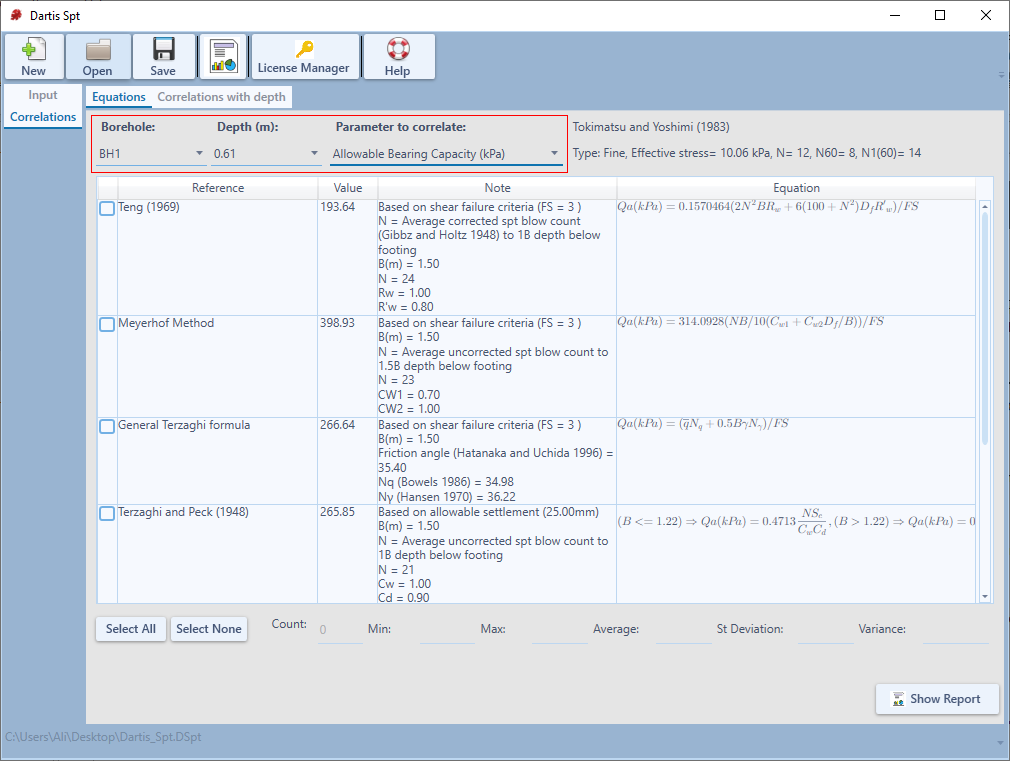
Correlated results #
When data entry in Dartis SPT is completed, press ‘Analyze borehole’ button. In Correlations and then Equations tab results are available. Dartis SPT uses more than 200 correlations to prepare these results. For each soil parameter in depth of a selected borehole (e.g. “Allowable bearing capacity”), all available correlations are summarized in a table describing the reference, parameter value, Equation, and Notes regarding each correlation used. The following screen shot shows the correlation table:
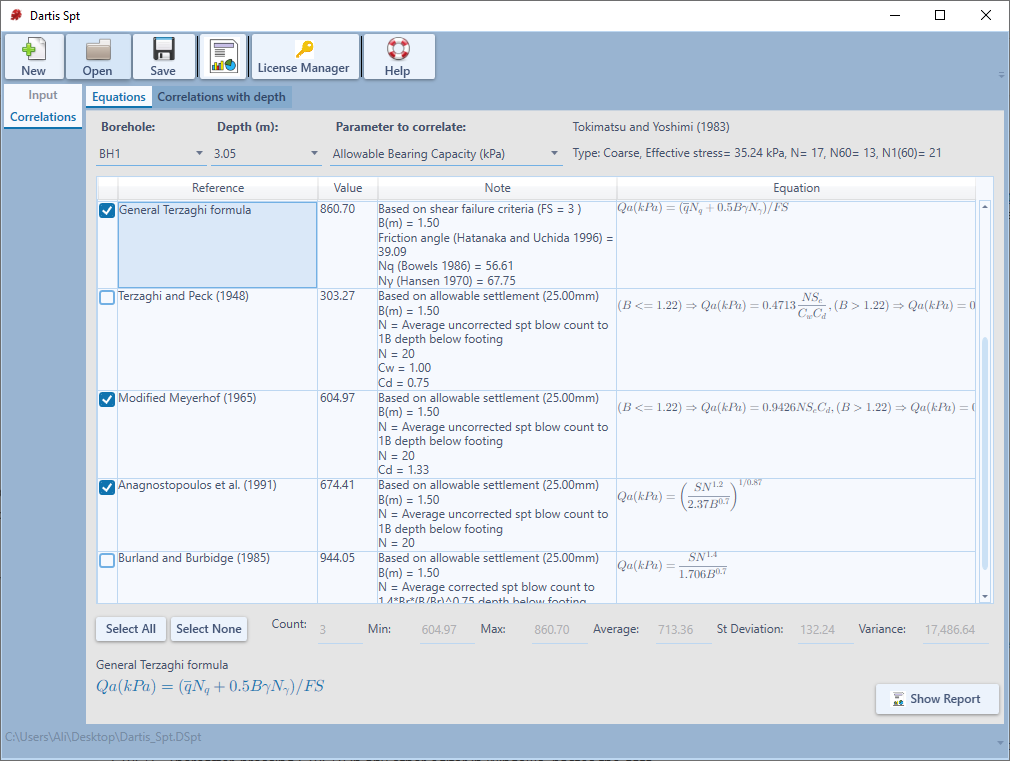
Sorting #
By clicking on the ‘Value’ header, rows are sorted numerically.
By clicking on the ‘Reference’ or ‘Note’ headers, rows are sorted alphabetically.
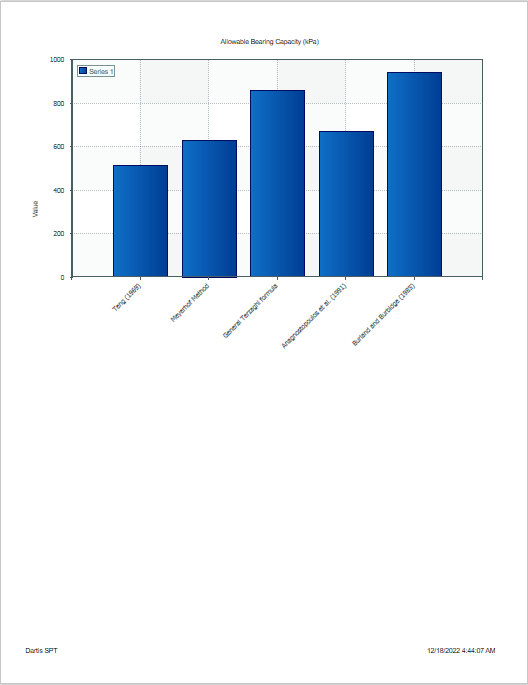
Correlated results Report #
Each method may be turned on/off by using the check box in the first column and will be added/removed from the designed report for this tab. Statistical variables are calculated for selected methods.
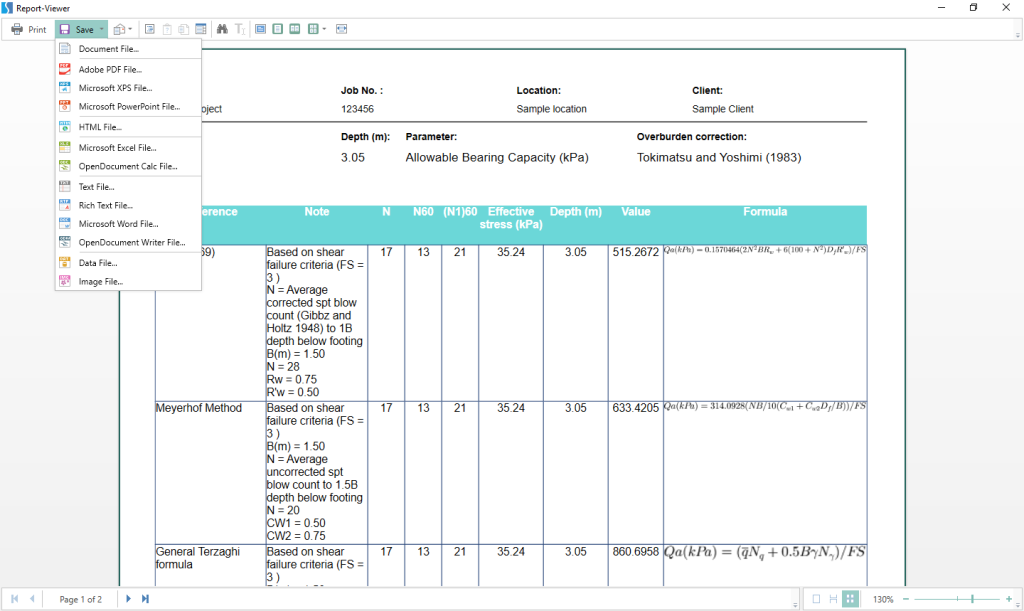
The following screen shots show a sample Report regarding this page:
Exporting Formats #
In report viewer choose exporting format by clicking on Save button:
Correlation with depth #
This feature is designed to plot the variation of a soil parameter in depth of a borehole based on SPT blow counts, and is accessible from Correlations → Correlations with depth. Follow these steps to obtain the correlation in depth of borehole:
1.Select the desired soil parameter (Elastic Modulus is selected in the following screen shot)
2.Select the correlations from the list (Three of the selected methods can be seen in the screen shot)
3.Click on ‘Plot Selected Methods’ button
4.If necessary, remove or include more methods from the list and repeat step 3
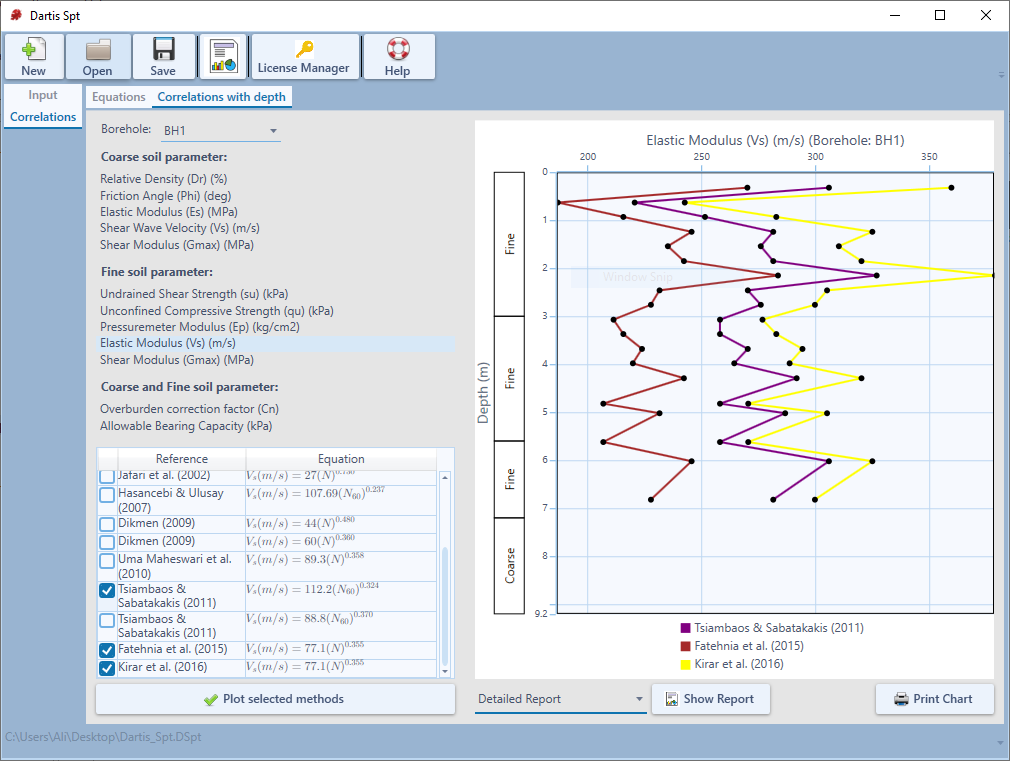
Note : By choosing a Fine soil parameter, the graph will plot along fine soil layers. Soil grain size at a depth is obtained from soil layers input.
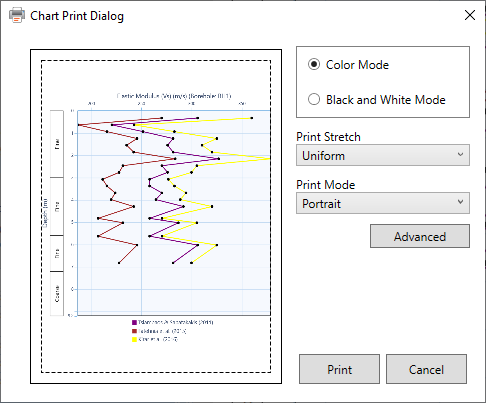
Printing Chart #
Either click on ‘Print Chart’ button at bottom right side of page or right click on the chart and choose ‘Print Chart’ between options. A chart print dialogue will open. Click on ‘Print’.
Correlations with depth Report #
Each method may be turned on/off by using the check box in the first column and will be added/removed from the designed report for this tab.
From the combo box choose required report (Detailed Report / Standard Report / Only data table report) and click on ‘Show Report’.
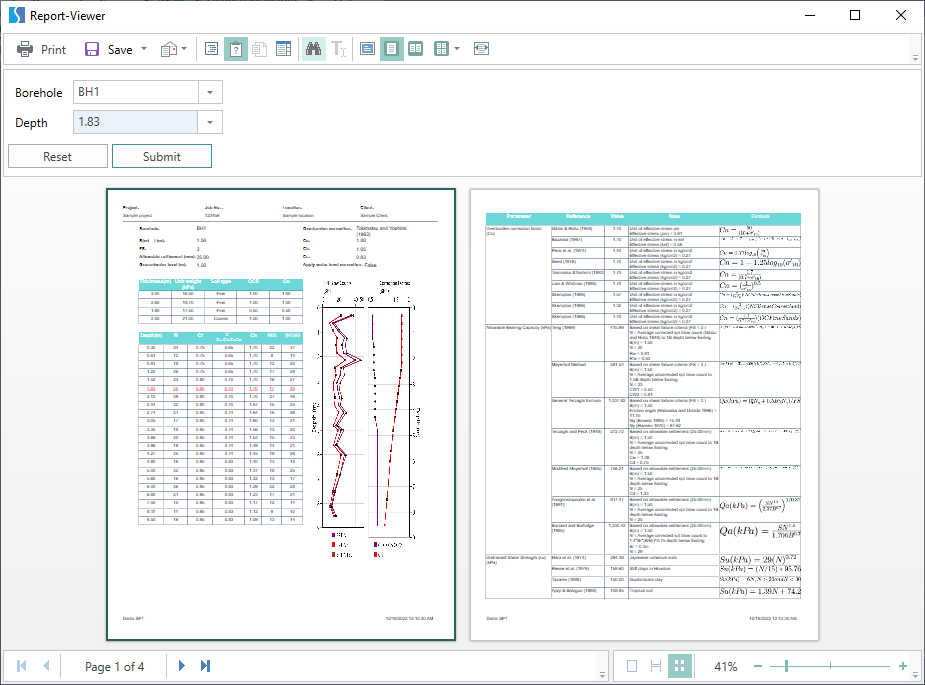
Report #
By clicking on button on toolbar, report viewer opens. Simply select the Borehole and then the required Depth. Click on Submit button. This will generate the report. Report can be Printed or be saved in desired format (PDF, Excel, Word, Image …).