Toolbar #

New button

Creates a new project: by clicking on ‘New’ button, a dialogue will open. Choose the location where you want the project to be saved. Files are saved with *.DLab extension.
Open button

Opens a previously created project file: by clicking on Open button, an open dialogue will show up. Choose the save file on your local hard. Files are stored with *.DLab extension.
Save button

Saves currently open project: saves current project’s information on currently open save file.
button

Opens project information tab. More information is provided here.
button

Opens Borehole and sample Manager tab. More information is provided here.
License Manager button
Opens License Manager window.
Help button

Opens current help manual.
Check for Updates button
Checks for available updates.
Project information #
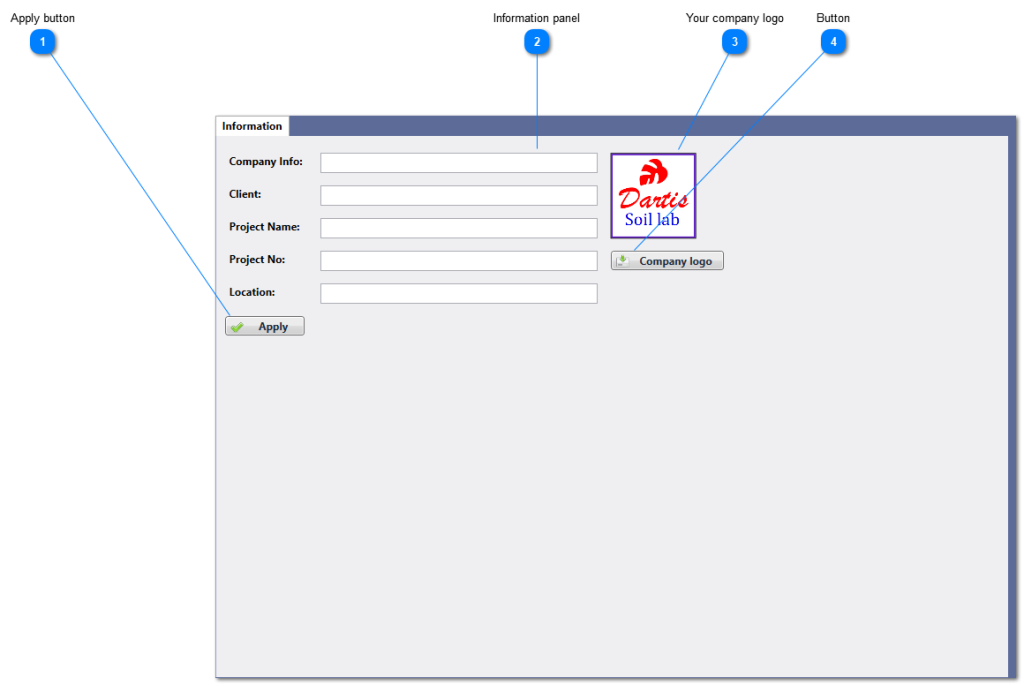
Apply button

Applies entered information
Information panel

You may enter project’s information here
Your company logo

Button

Opens a selection dialogue. You may choose your company logo image path within dialogue.
Borehole and sample Manager #
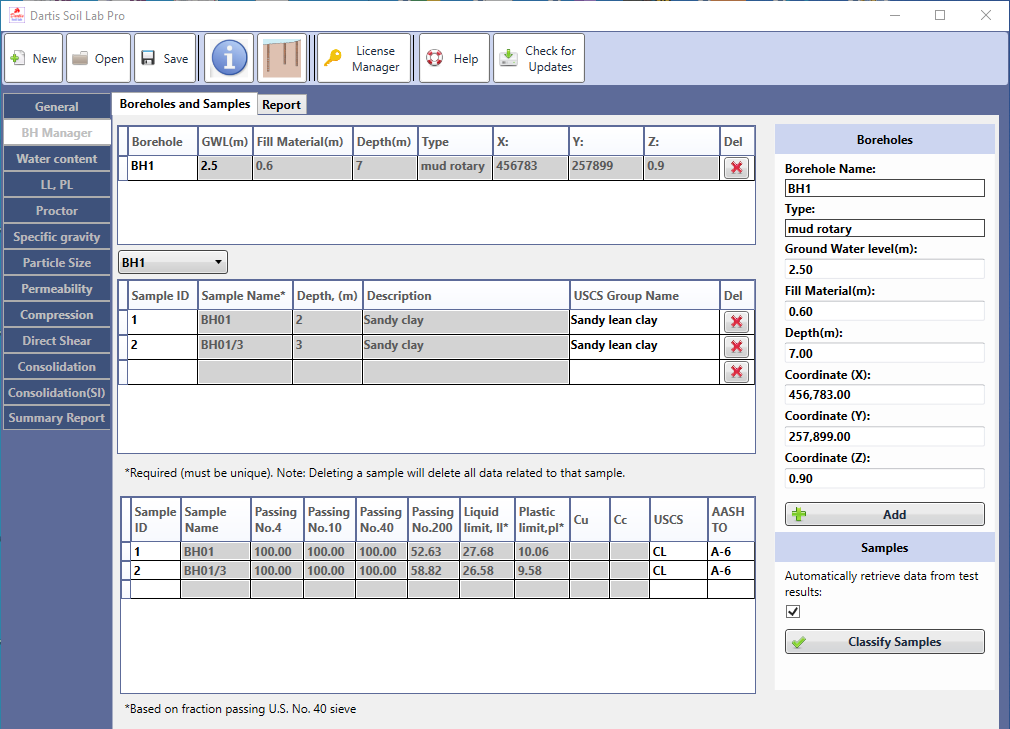
- enter borehole name and properties and click add
- select required borehole from combo box
- complete a table row to assign new sample to that borehole and press ENTER to create a new row ( you can use TAB KEY to go to next cell).
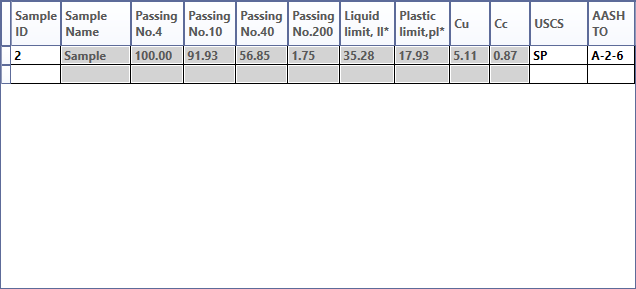
classification table #
data in this table is automatically retrieved from particle size and index tests results while checkbox is checked.
also you can complete this table manually and click on classify samples.
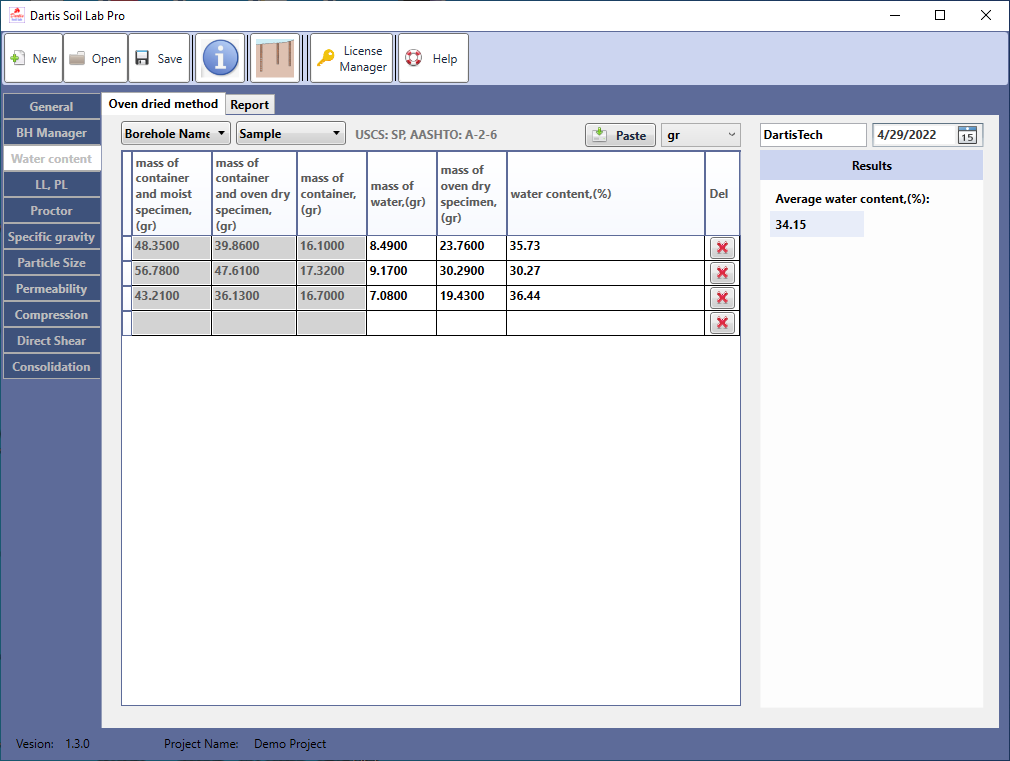
Water content #
This page is used for data entry of moisture content determination test and to view / print the results
- select the borehole and then sample
- complete the table. data may be entered manually or by importing from Excel using paste button.
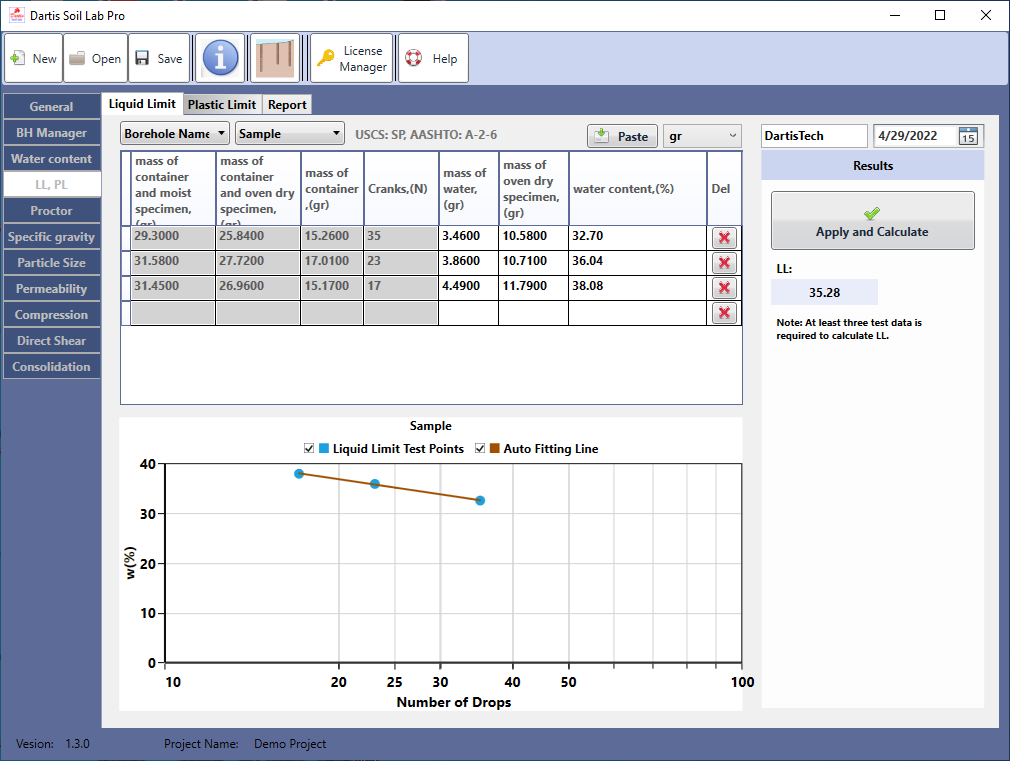
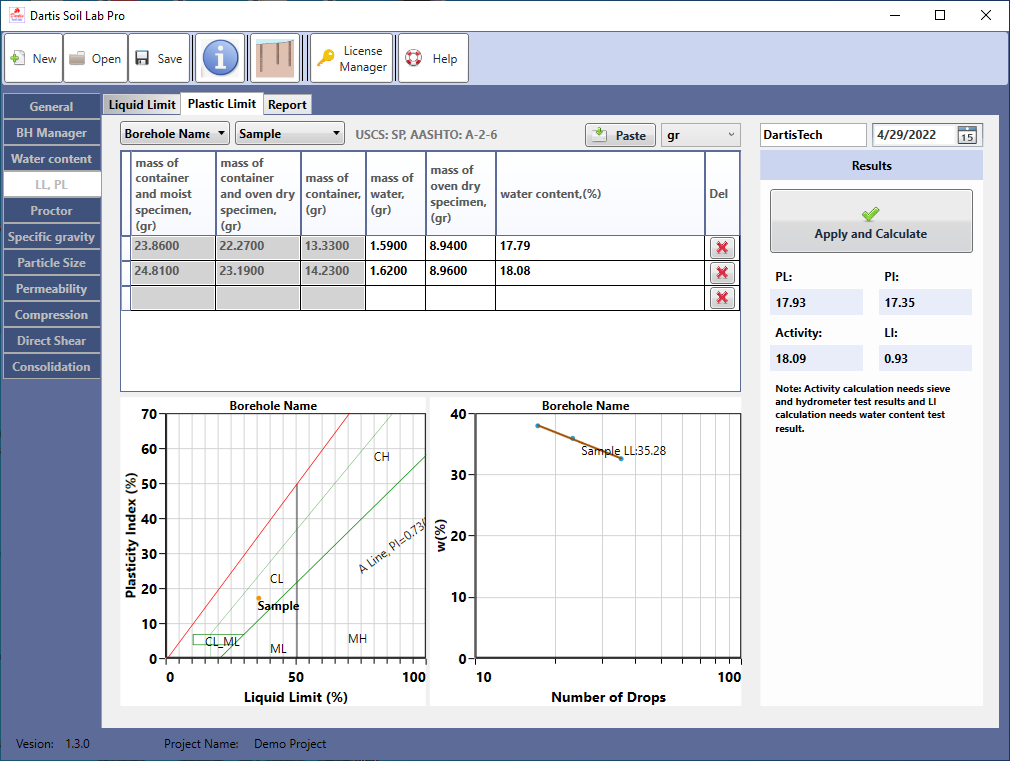
Liquid and plastic limit #
This page is used for data entry of Liquid an Plastic limit tests and to view / print the results
Liquid Limit #
- Select a borehole and then sample
- complete the table. data may be entered manually or by importing from Excel using paste button.
- click on apply and calculate
Note: at least three test data is required to plot graph and calculate LL value;
Plastic Limit #
- Select a borehole and then sample
- complete the table. data may be entered manually or by importing from Excel using paste button.
- click on apply and calculate
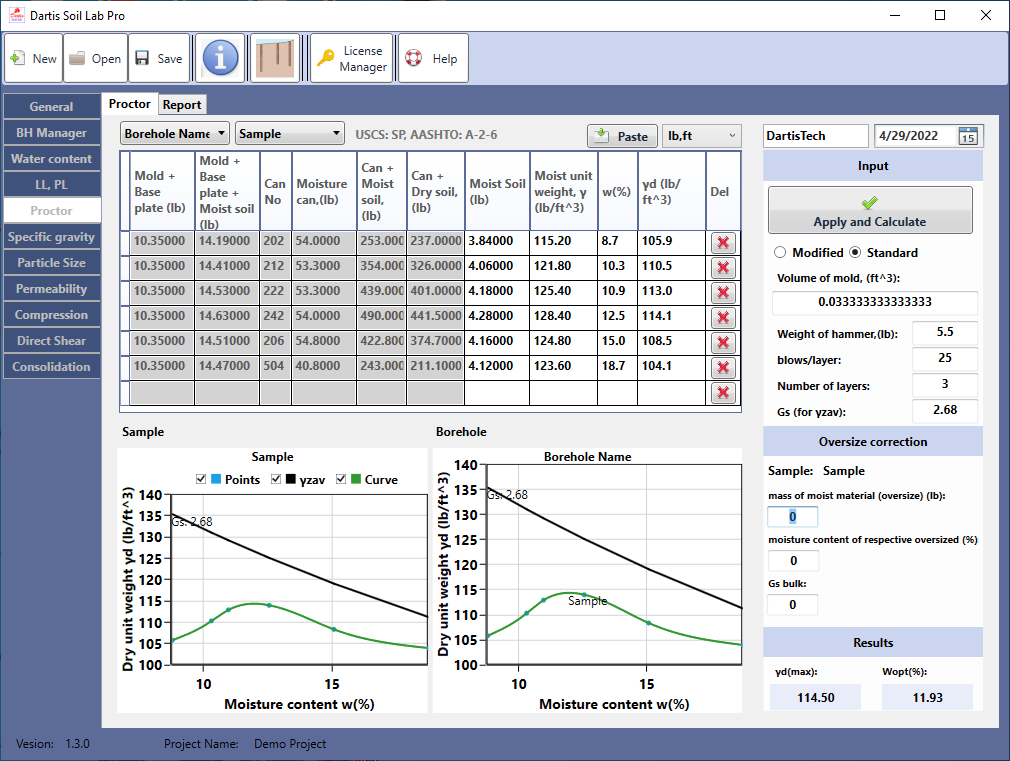
Proctor #
This page is used for data entry of compaction test and to view / print the results
- Select a borehole and then sample
- enter input data
- complete the table. data may be entered manually or by importing from Excel using paste button.
- if oversize correction is needed enter required data for the selected sample
- click on apply and calculate
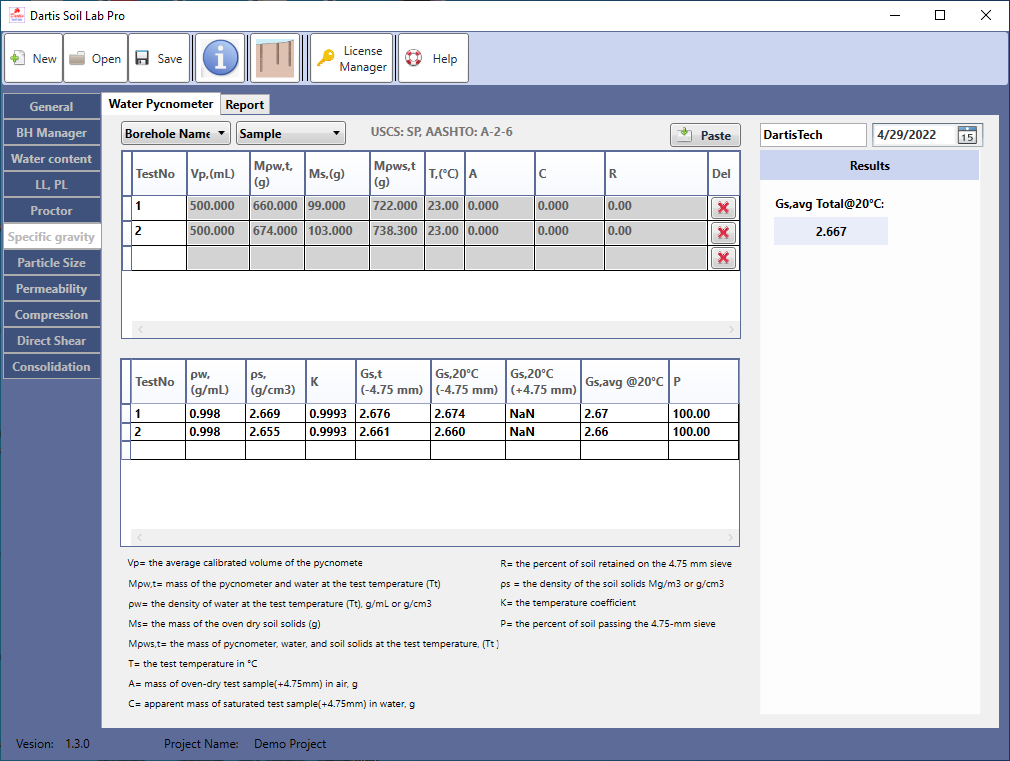
Specific gravity #
This page is used for data entry of specific gravity test and to view / print the results
- Select a borehole and then sample
- complete the table. data may be entered manually or by importing from Excel using paste button.
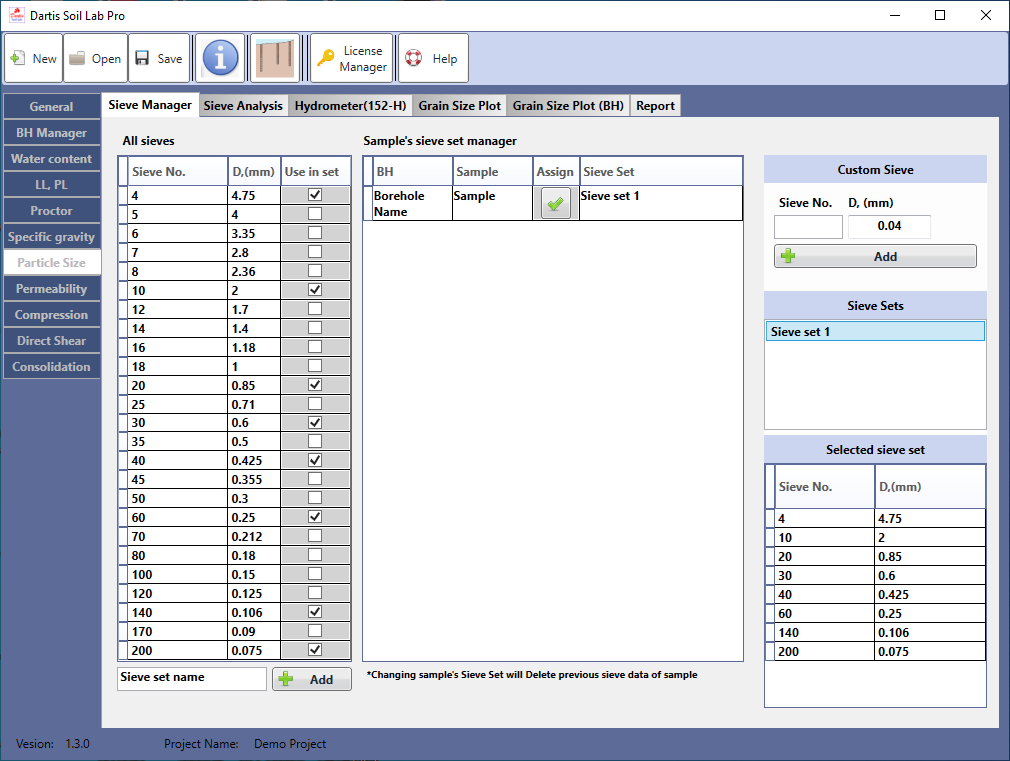
Particle size #
This page is used for data entry of particle size test and to view / print the results
sieve manager #
- select required sieves from all sieves table, enter sieve set name and press add
- select a previously created sieve set from sieve sets table
- in sample’s sieve set manager click assign. this will assign selected sieve set to that sample
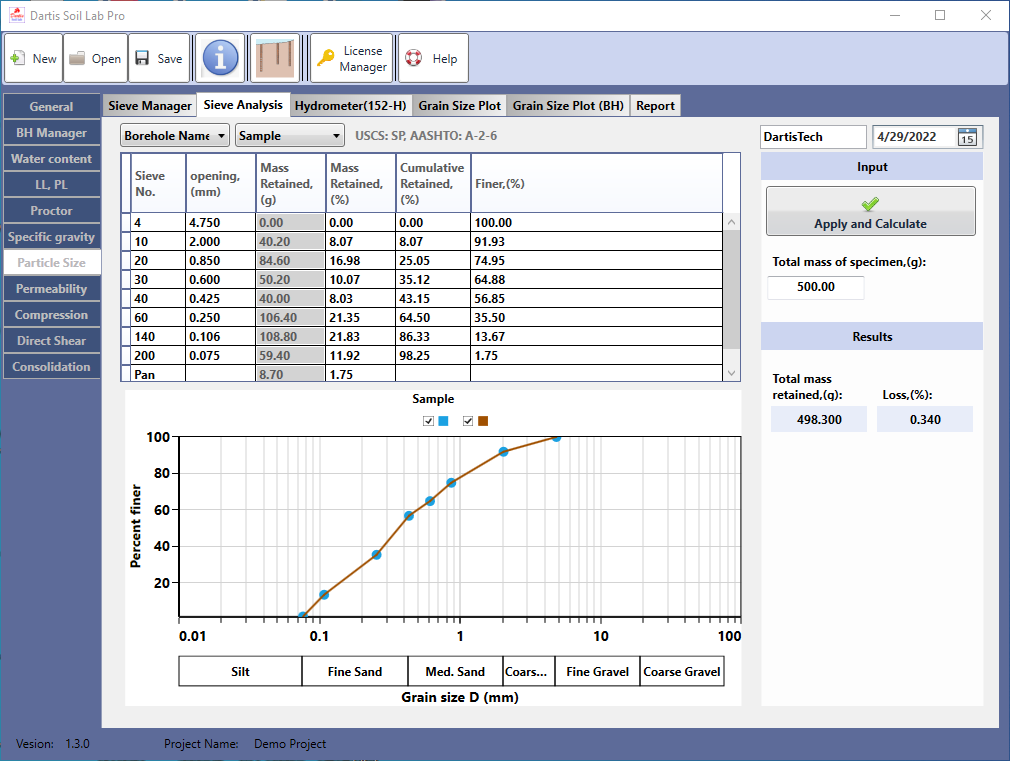
sieve analysis #
- Select a borehole and then sample
- enter input data
- complete the mass retained on each sieve row by row.
- click on apply and calculate
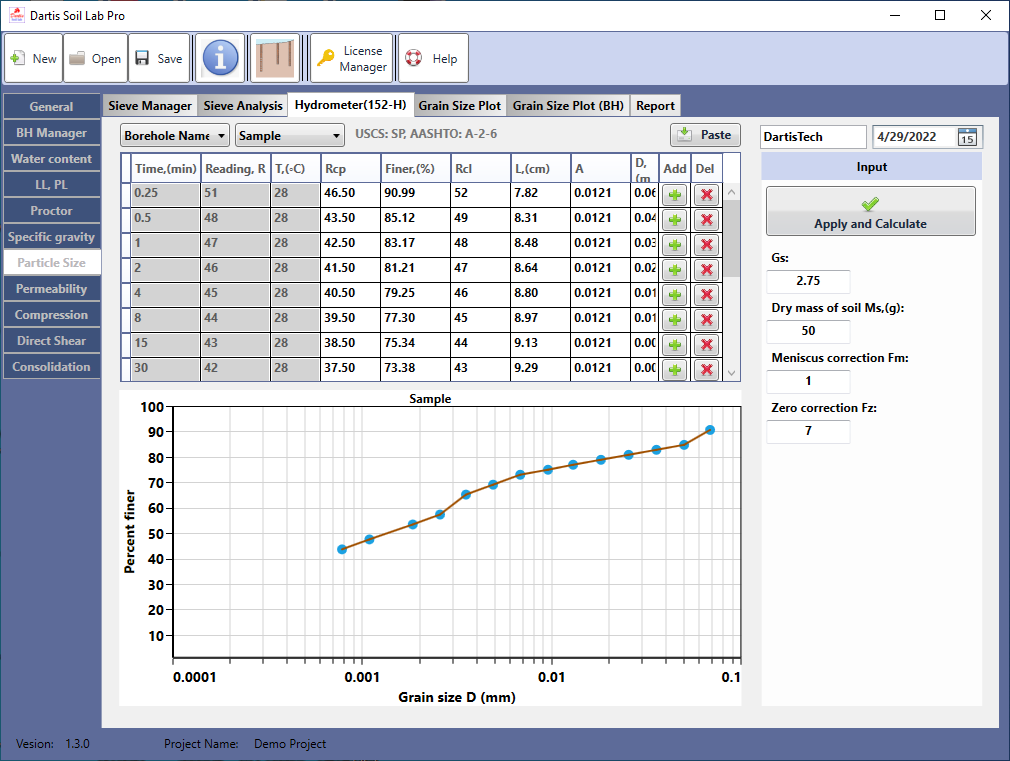
hydrometer #
- Select a borehole and then sample
- enter input data
- complete the table. data may be entered manually or by importing from Excel using paste button.
- click on apply and calculate
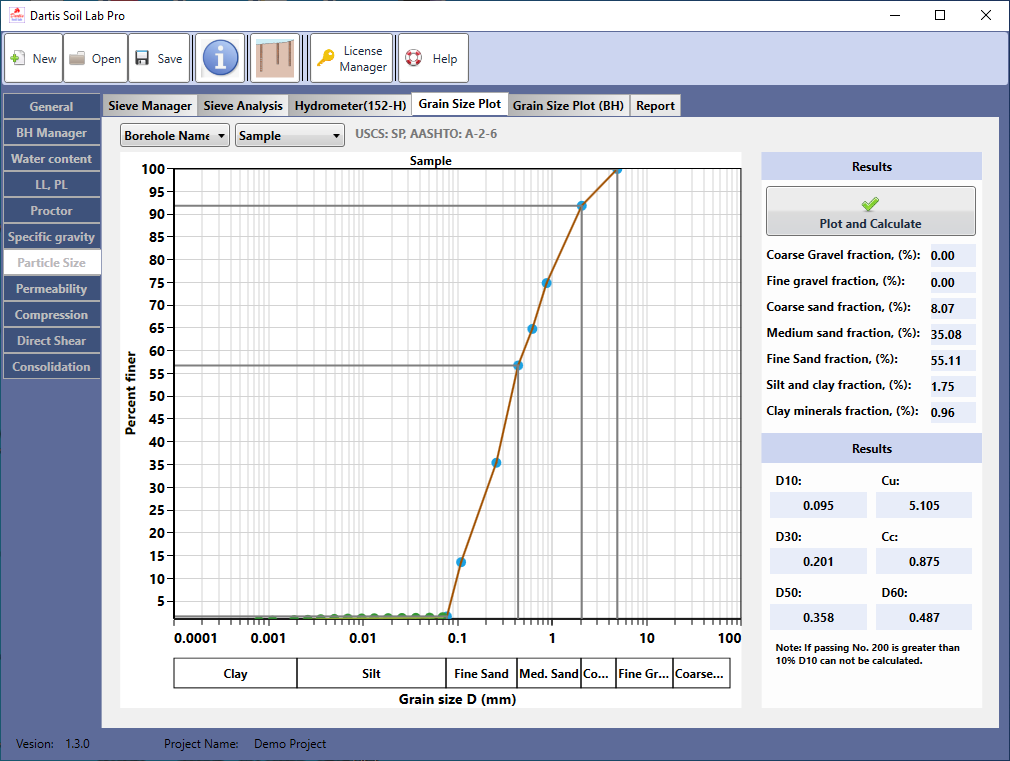
grain size plot #
- Select a borehole and then sample
- click on plot and calculate
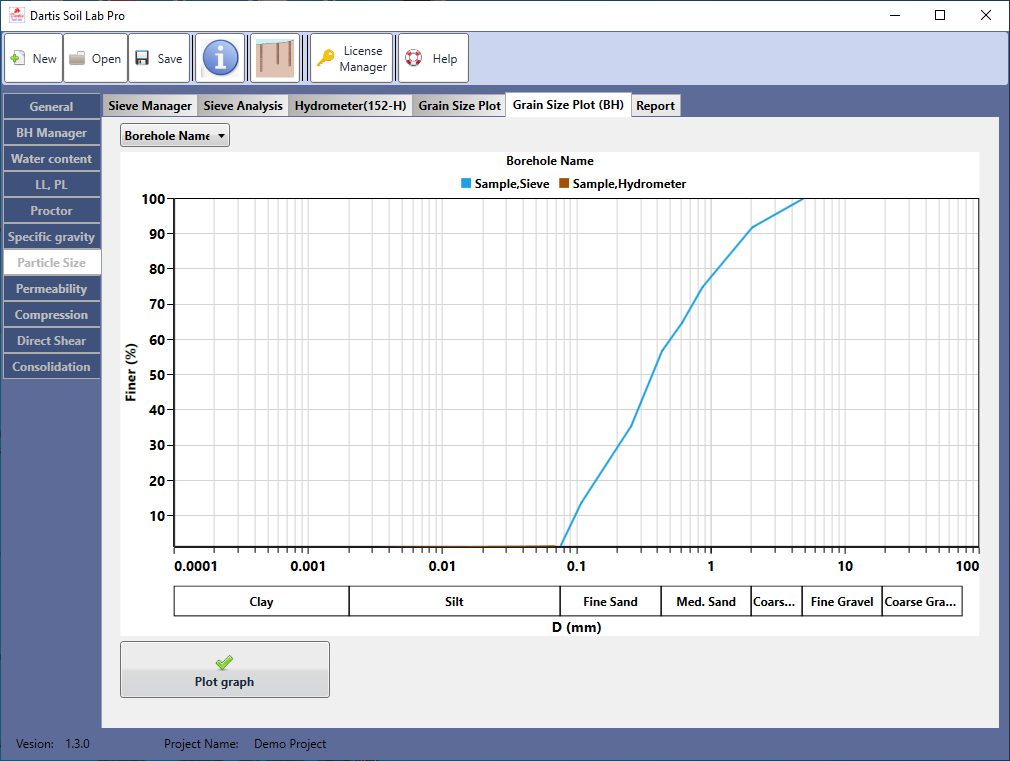
borehole samples grain size #
- Select a borehole
- click on plot graph
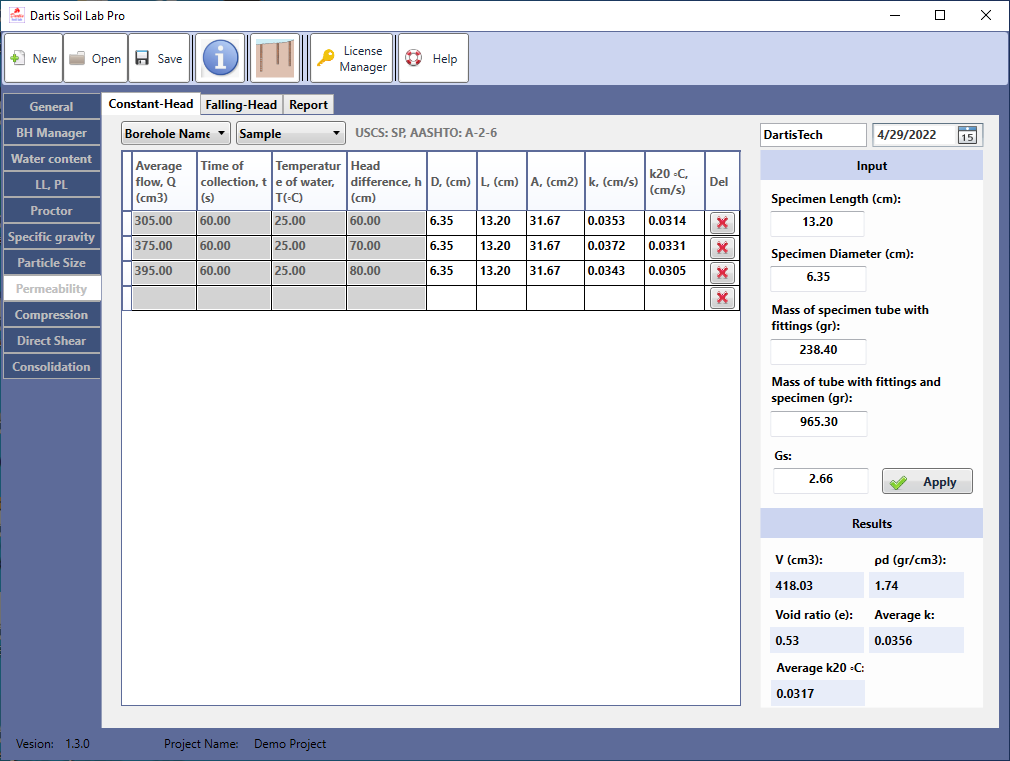
Permeability #
This page is used for data entry of permeability test and to view / print the results
constant head #
- Select a borehole and then sample
- enter input data and click on apply
- complete a table row and press ENTER to create a new row ( you can use TAB KEY to go to next cell)
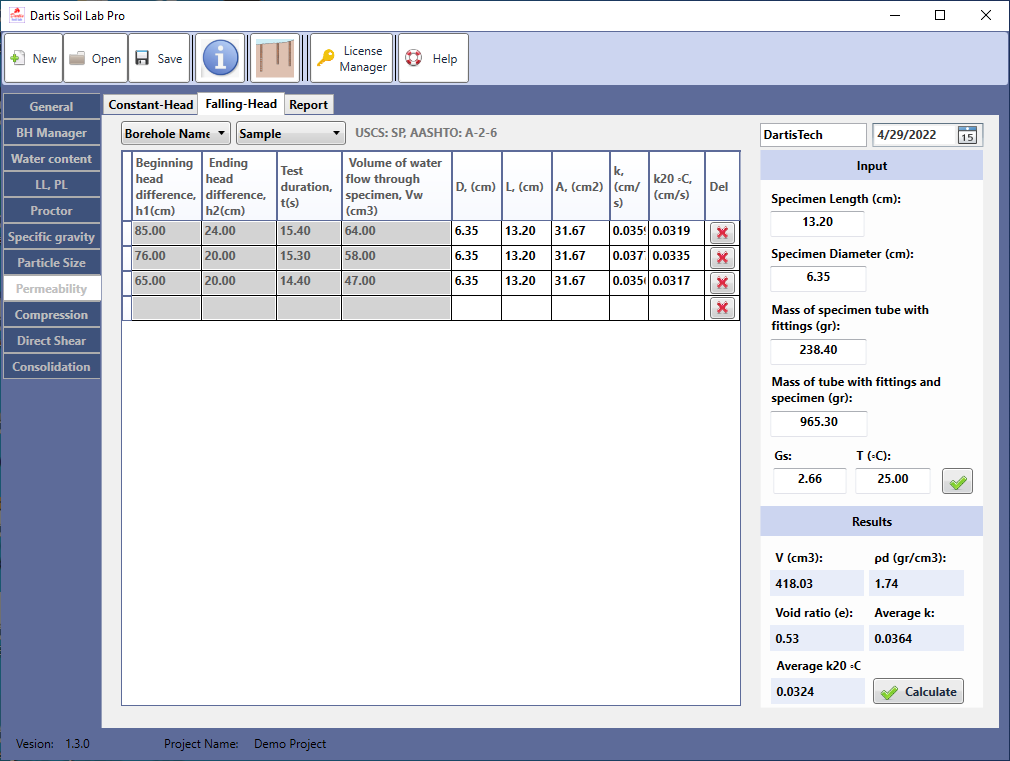
falling head #
- Select a borehole and then sample
- enter input data and click the check button.
- complete a table row and press ENTER to create a new row ( you can use TAB KEY to go to next cell)
- click on calculate
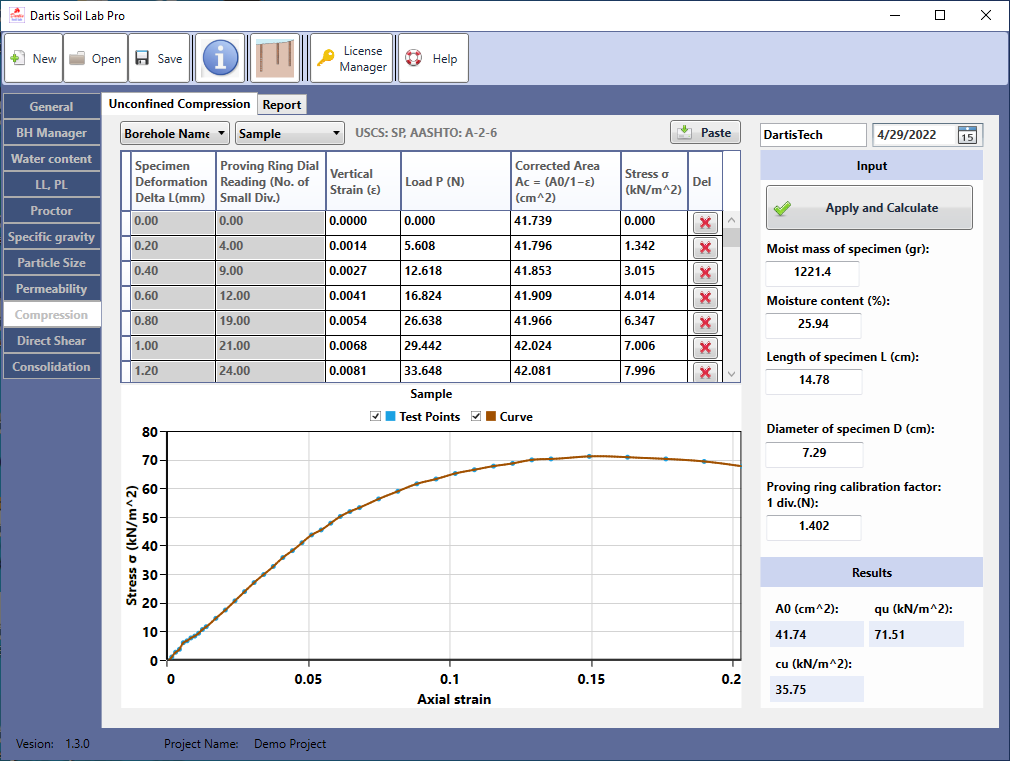
Unconfined compression #
This page is used for data entry of unconfined compression test and to view / print the results
- Select a borehole and then sample
- enter input data
- complete the table. data may be entered manually or by importing from Excel using paste button.
- click on apply and calculate
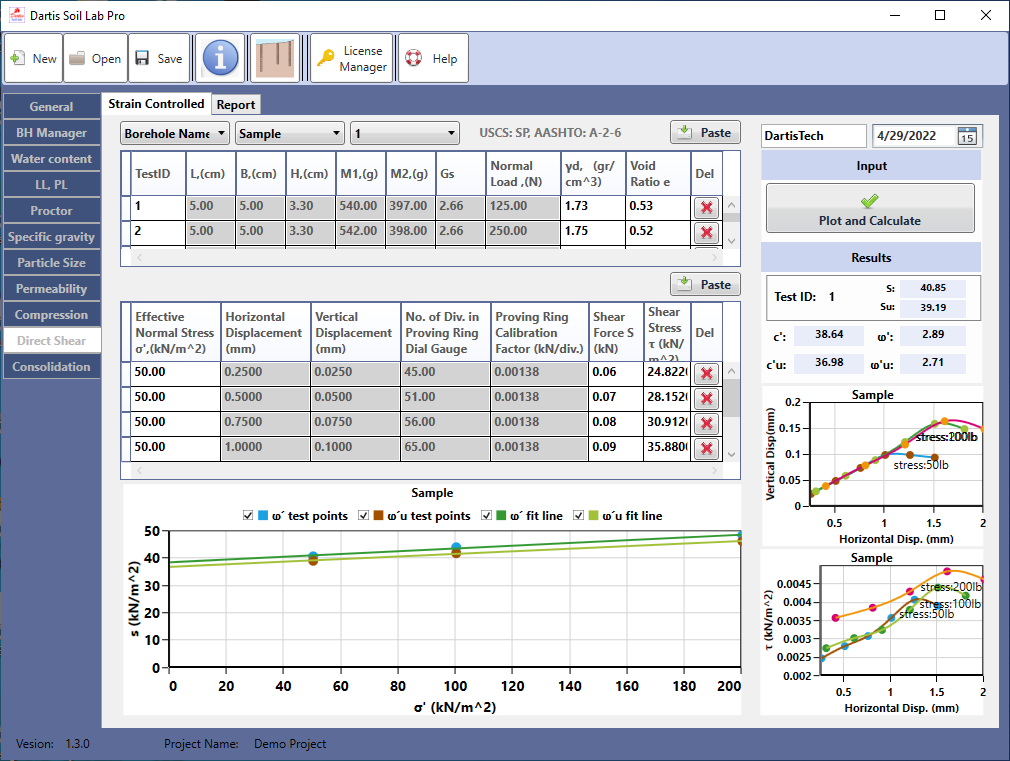
Direct shear #
This page is used for data entry of direct shear test and to view / print the results
- Select a borehole and then sample
- Enter data of selected sample row by row in first table or just paste data from Excel.
- Select test id form Test ID combo box.
- Enter data of selected test id row by row in second table or just paste data from Excel.
- Click on plot and calculate
Note: At least 3 test data is required for each sample to plot main graph
Consolidation #
This page is used for data entry of consolidation test and to view / print the results
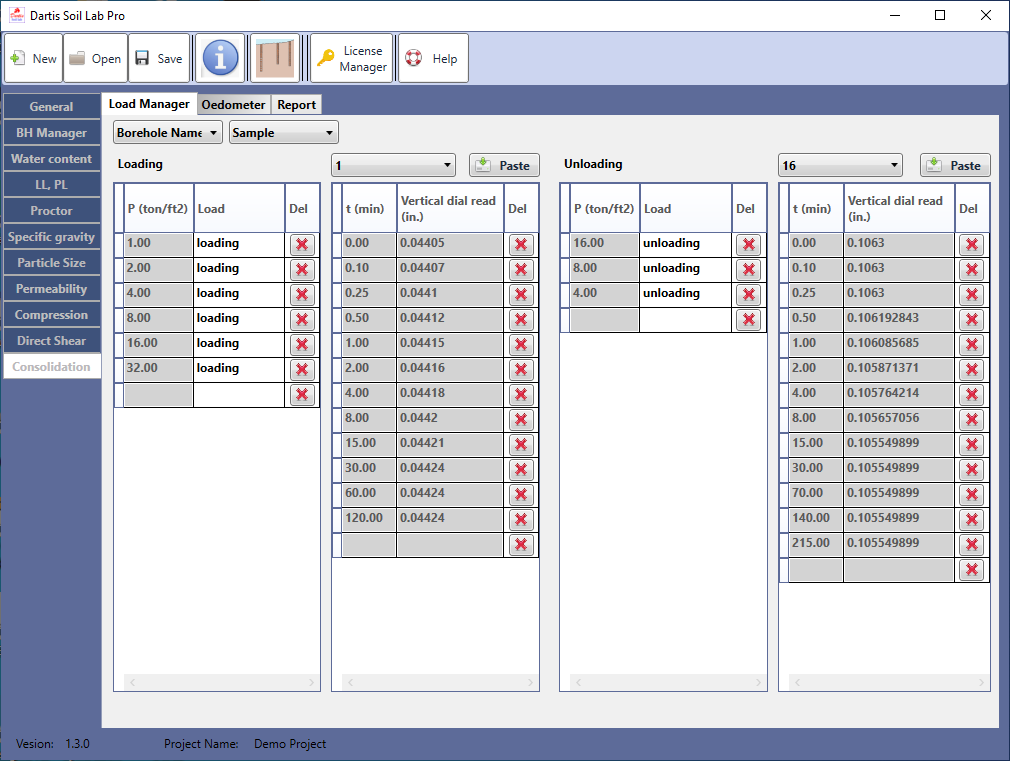
Load Manager #
- Select a borehole and then sample
- Enter P in loading and unloading tables manually.
- For each loading first select it from combo box then complete time and dial read table by entering data manually or by pasting data from Excel.
- For each unloading first select it from combo box then complete time and dial read table by entering data manually or by pasting data from Excel.
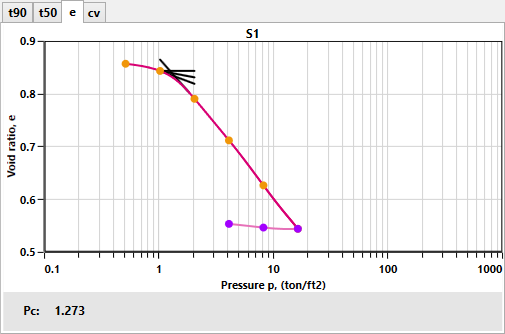
Oedometer #
- Select a borehole and then sample
- enter input data
- click on apply
- select P from third combo box
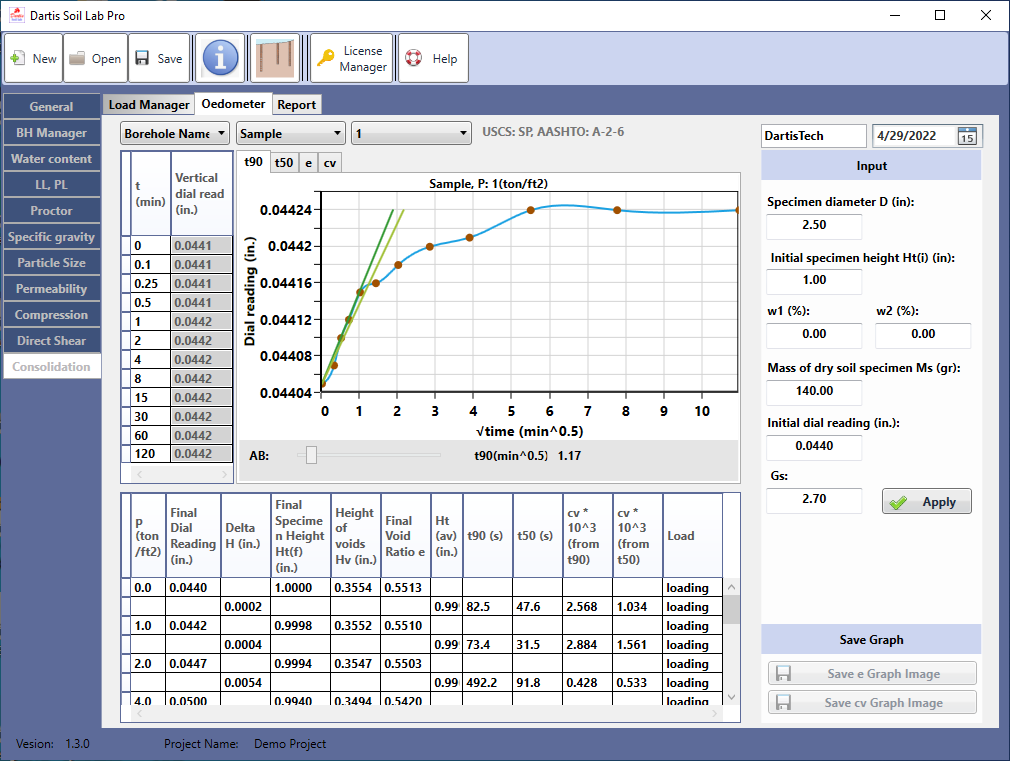
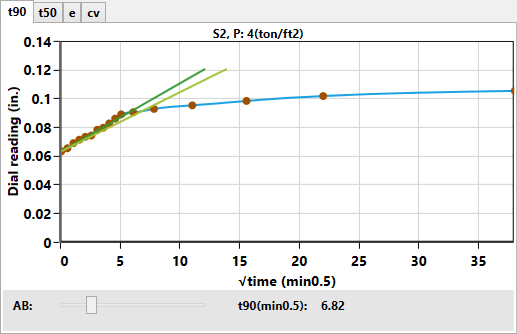
for each P use (AB) scroll bar to determine t90
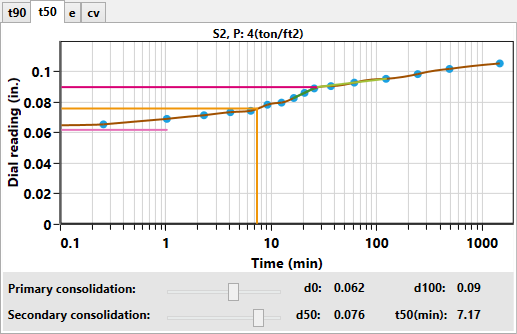
for each P use primary and secondary consolidation scroll bars to determine t50
select (e) tab and then click save e graph image
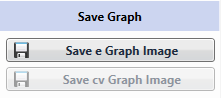
select (cv) tab and then click save cv graph image